Purpose
1) Develop the sinusoidal equations of motion for a pendulum.
2) Compare the experimental period to the calculated period T=2π√(L/g)
2) Compare the experimental period to the calculated period T=2π√(L/g)
Equipment
Stand with a mass hanging from a string
Recording device
Logger Pro
Board with measurements labeled to determine distance of the mass from equilibrium
Recording device
Logger Pro
Board with measurements labeled to determine distance of the mass from equilibrium
Procedure
Set the pendulum up with the mass hanging from it and the measuring board behind it. Start recording at an adequate distance away to still see mass and meter stick clearly.
Release mass from a height an appropriate distance away and record video for at least 4 complete cycles.
Analyze video using Logger Pro and Excel and get time versus distance from center data.
Calculate the period of the sin wave and compare it to the theoretical period derived from the above formula.
Data
Length of string was .46m
| vid00015.avi |
Data Analysis
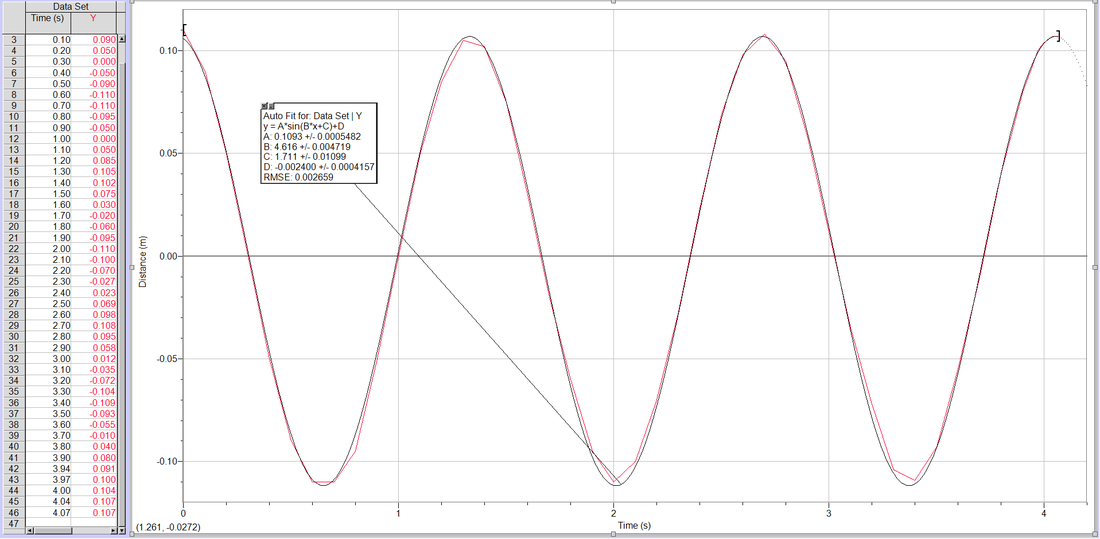
Using T=2π/B I found the period to be 1.3612s. Using T=2π√(L/g) the theoretical period is 1.3606s. This leaves us with a percent error of 0.044%
Conclusion
We found the equation of the distance vs time graph to be y=0.1093*sin(4.616*x+1.711)-0.002400. We found no questionable data and the only surprising result was that our percent error was .044% which was much lower than expected. With such a low percent error there were no significant sources of error, but the small error we did get was probably due to the very small mass in the string and air resistance or the blur in the video.
